
How IREX and DG’s Data Ecosystem Assessment Tools Advance Local Priorities
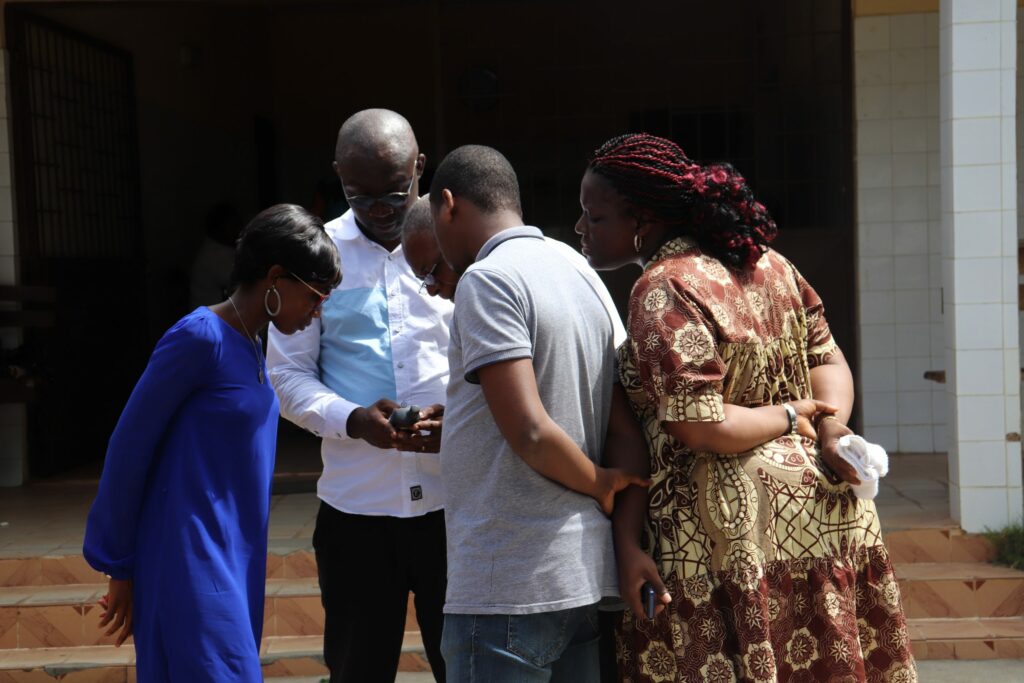
IREX’s Data Compass and Development Gateway’s CALM are methodologies for assessing data ecosystems. While each methodology produces different outputs based on different needs, both prioritize local collaboration and development to produce insights and outputs that reflect local priorities and actionable recommendations that institutions can own and implement.
Cashew-IN Platform Demo
Development Gateway (DG) and Cultivating New Frontiers in Agriculture (CNFA) have partnered to launch an innovative platform to support the West African cashew sector and increase profitability for cashew farmers. Comprehensive and reliable data is required for cashew farmers, producers, processors, and others in the West African cashew sector to increase profits, reduce loss, and improve global competitiveness.
In this video, Vanessa Baudin Sanchez and Nadejda Mândrescu demonstrate the features of the Cashew-IN platform and discuss the underlying technology.
AD3ventures in Mapping
Administrative data – data from civil registration and vital statistics systems, and sectoral (health, education, judicial, social protection) management information systems – is rich with insights on citizen needs and priorities. Though timely and disaggregated administrative data can complement official statistics, it comes with its own data quality, availability, and use challenges.
AD3 ou une aventure cartographique
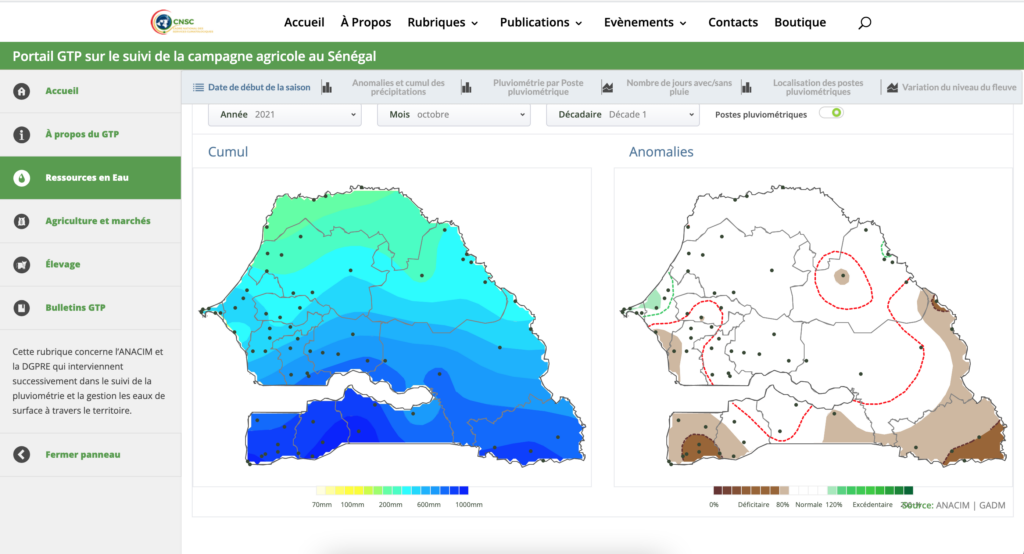
Par le biais d’AD3, nous avons développé un tableau de bord qui se concentre sur le climat, les prix du marché, les maladies du bétail, le niveau des fleuves et les précipitations annuelles, entre autres thèmes. Si le tableau de bord lui-même est un référentiel d’informations utile, la méthode d’élaboration des cartes et d’itération des commentaires des utilisateurs a permis d’identifier les bonnes pratiques en matière de visualisation des données.
Designing Data Visualizations: Merging Best Practices and Design Thinking
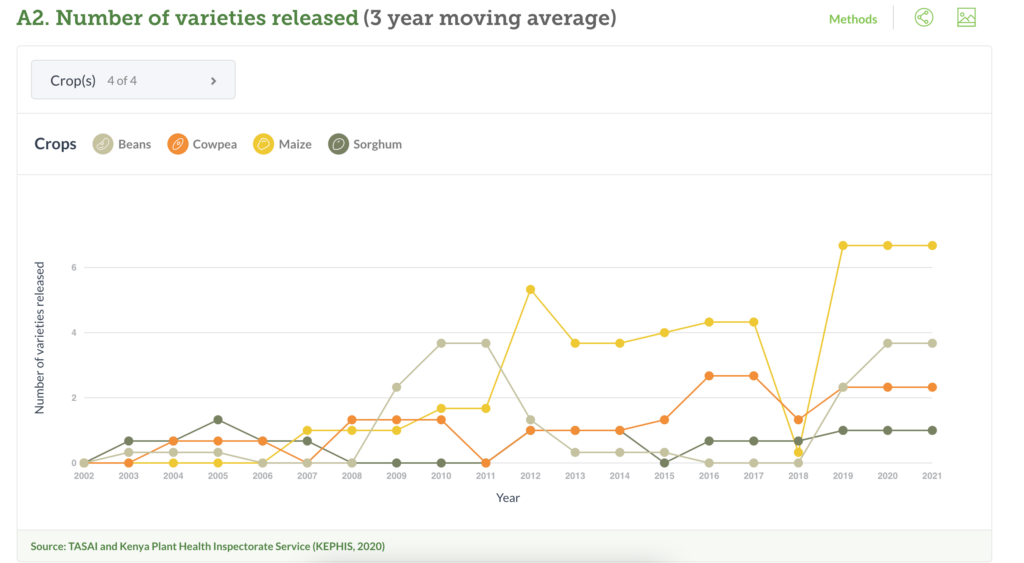
DG has been co-designing data visualizations with partners and stakeholders for over a decade. Thinking about the ways people process information is crucial to developing easy-to-understand data visualizations. In this post, we examine best practices for incorporating user-centered design into our data visualization outputs.
Episode 3, Season 1 | Geography: Expanding & Deepening DG’s Regional Footprint
In Episode 3 of “Data… for What?!”, Development Gateway’s new podcast, we explore how we are prioritizing our geographical focus in the coming years. Conversations with Vanessa Baudin Sanchez, Carmen Cañas, and Charlene Migwe-Kagume highlighted the opportunities and challenges of expanding our portfolio in Central America and deepening our work and partnerships in West, East, and Southern Africa.
What We Know So Far: Best Practices in Developing Data Governance Frameworks

Data governance frameworks are essential as data and technology continue to become increasingly central to how governments, institutions, groups, and individuals all interact with one another and among themselves. Here are the best practices DG has learned in creating data governance frameworks so far.
Price & Availability: the Impact of Russia’s Invasion of Ukraine on African Fertilizer Markets
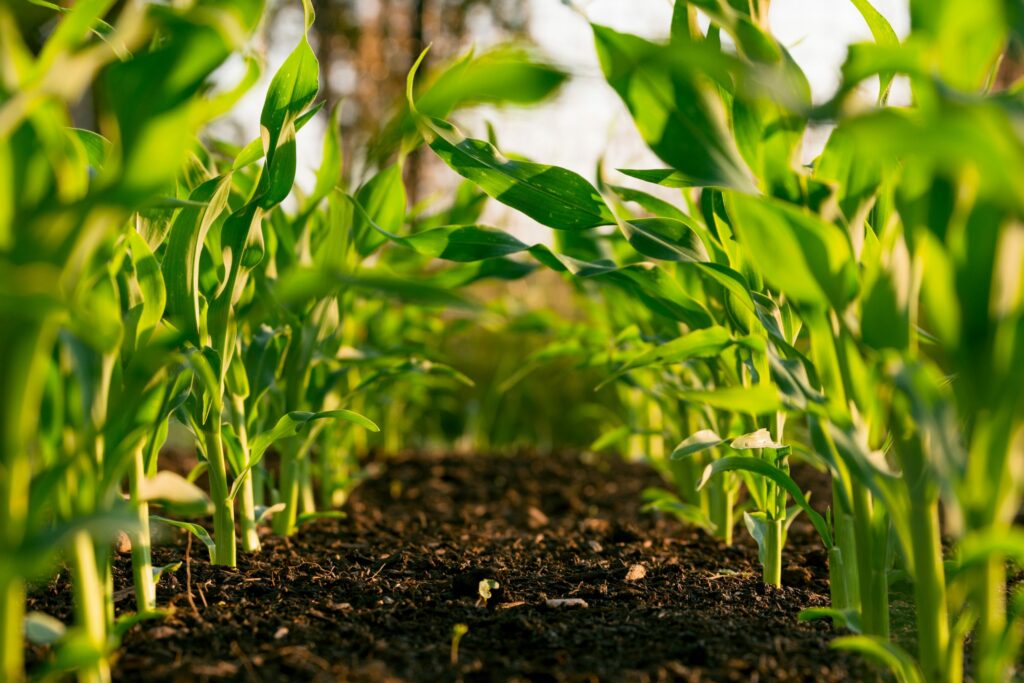
In response to fertilizer availability challenges in sub-Saharan Africa which are fueled by the ongoing Russian invasion of Ukraine along with a host of pre-existing factors including COVID-19, VIFAA is now launching the Africa Fertilizer Watch to track regional and country-level market indicators, productivity and production distortions on food production and agriculture.
Improving Land and Crop Use Data in Nigeria – The VIFAA Innovation Fund
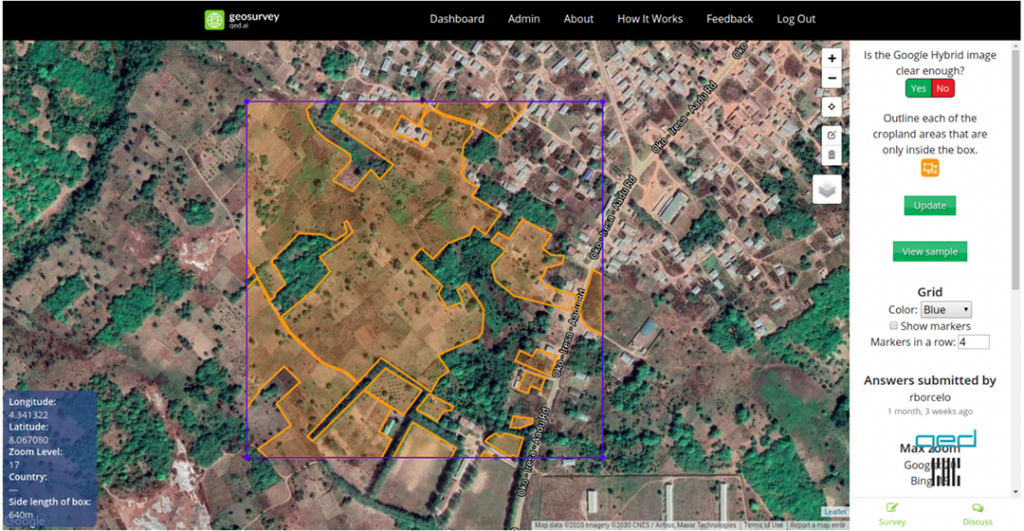
Our Visualizing Insights for Fertilizer in African Agriculture (VIFAA) Program launched an Innovation Fund to address data shortages relating to total crop production. Building on its track record of mapping land cover, Quantitative Engineering Design (QED) was selected to tackle the challenge of mapping Nigeria’s croplands. Through the Innovation Fund, DG and partners will use the resulting data and maps to answer two questions: (a) what is the total cropland under production in Nigeria and (b) what is the cropland under production by crop type.